National discard stream composition estimates
With the increase in plastic production and use, more plastics are discarded. A 1994 EPA study of the national supply of discards says that in 1970, plastics composed less than 3% by weight of the municipal supply. By 1986, they had risen to 6%.
For 1993, the EPA estimates that the US burned or buried 207 million tons of discards or 1,600 pounds per person. Their composition estimate for the discard stream is represented in the following table :
Table 2: Composition of the US Municipal Discard Stream, 1993
| Material Type | Discarded (million tons) | Percent of Total |
|---|---|---|
| Paper and Paperboard | 77.8 | 38 |
| Food and Yard Trimmings | 49.7 | 24 |
| Plastics | 19.3 | 9 |
| Metals | 17.1 | 8 |
| Wood | 13.7 | 7 |
| Glass | 13.7 | 7 |
| Other | 15.7 | 7 |
| Totals | 207.0 | (100) |
Of the estimated 19.3 million tons of plastics burned or buried in landfills, 8.1 million tons, or 63 pounds per person per year, was plastic packaging materials.
In states where beverage containers have redemption or deposit value, the proportion of these containers in the garbage has dropped significantly. For example, an estimated 28% of all PET bottles sold in the US is recovered, and 90% of those came from states with bottle bills or mandated deposits. Nevertheless, even as plastic reprocessing rates have increased, the amount of virgin resins produced has risen much faster.
Berkeley, CA discard stream composition estimates
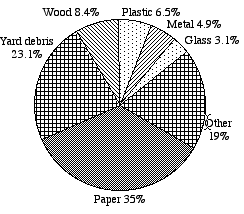
A study of Berkeley, California’s waste stream, which totaled 100.4 thousand tons after diversion in 1991, showed the following major components:
Table 3: Composition of Berkeley’s Municipal Waste Stream, 1991
| Material Type | Amount Wasted (thousand tons) | Percent of Total |
|---|---|---|
| Paper and Paperboard | 35.2 | 35.0 |
| Food and YardTrimmings | 23.2 | 23.1 |
| Wood | 8.4 | 8.4 |
| Plastics | 6.5 | 6.5 |
| Metals | 4.9 | 4.9 |
| Glass | 3.1 | 3.1 |
| Other | 19.1 | 19.0 |
| Totals | 100.4 | (100.0) |
The quantity of plastic in the Berkeley waste supply is compared with the quantities of other materials in the pie chart below.
Figure 3: Waste Composition After Diversion,Berkeley, CA, 1991
Of the plastics discarded in Berkeley in 1991, almost 47% was film plastics such as bags and wrapping, and 43% was mixed plastics including polystyrene foam. Seventy tons was PET, and 582 tons was HDPE. Since PET and HDPE are the only plastic resins that have accessible markets, this means that only 10% of plastic discards or less than 1% of Berkeley’s total waste stream would be targeted for recycling. As will be discussed in the following section, a curbside collection program could capture only a fraction of this target material.


